
Utility Tracking at a Glance
The Utility Tracking Center [UTC] features services for tracking and evaluating energy billing and consumption. Under the FM Program, in addition to the annual performance report that tracks facilities energy-use reduction, the Program also provides services for inventory of utility accounts and meters, and analysis of energy pricing and utility billing practices. Where applicable, we transmit relevant advisories and updates based on the frequently changing landscape of energy regulations, utility tariffs, program offerings, and site accreditations.
The UTC produces an Energy Consumption Performance Report (eCPR) annually for clients participating in the FM Program. The report demonstrates energy savings based on actual utility billing data. Reduction of energy use provides both environmental value by reducing facilities carbon footprint, and also operational value by reducing facilities operating expenditures.
Energy Consumption Performance Report (eCPR)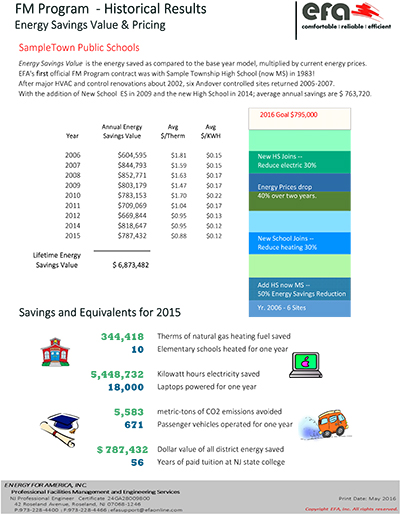
The annual consumption as recorded by the utility meters is compared to the consumption in the year prior to joining the Facilities Management Program (Base Year).
The comparison uses an adjusted Base Year Model using the current year's weather and occupancy factors.
Performance rating is based on the change in energy units consumed.
Typical Performance for a NJ High School
- Heating fuel reduced 25% to 40%
- Electricity reduced 5% to 15%
Delivered report includes building monthly billing data to facilitating auditing.
Value of Energy Savings
The environmental value of energy conservation is a smaller carbon footprint and reduced greenhouse gas emissions, which contribute to a cleaner earth.
For the purposes of the annual report, the dollar value uses the average price of the energy units consumed for the period of the report multiplied by the units saved.
Program results for a typical high school are energy savings valued at $95,000—equivalent to the elimination of 1,000 metric tons of greenhouse gas emissions or 115 passenger vehicles operated for a year.
Energy Pricing and Billing Analytics
Tracking and reporting on energy use requires a check on accuracy of billing practices and current energy pricing, including cost differences with third party supply (TPS) contracts.
While in the early days of TPS, EFA provided services for aggregate bids/contracts for natural gas supply, today we provide analytics and recommendations on the value of site participation.
Errors in utility billing or meter readings are not uncommon and discrepancies are revealed through the UTC processing. EFA prepares draft correspondence for correction requests that include engineering calculations and historical data as needed. All such requests have resulted in positive resolutions.
Utility Account Inventory
A Chart of Accounts is maintained for buildings participating in the Facilities Management Program including the change history of accounts and meters, notifications of failed or improper metering, verification of appropriate tariff, and third party delivery accountability.
EFA's historical inventory records can be used toward action fulfillment for certification points in the Sustainable Jersey for Schools program. As professional engineers, we are qualified to provide services for application for an Energy Star certification.
See Advanced Engineering Services
Energy Use Benchmarking
EFA's historical energy use database covers over 600 NJ schools for various periods since our start in 1980. There are national services that maintain usage profiles such as the Energy Star Portfolio and US Energy Information Administration's Commercial Buildings Energy Consumption Survey (CBECS).
When comparing energy use profiles, data must be filtered to use profiles of similar occupancy/activity use, similar climate and within a similar time period (5-10 years). Although, school heating fuel profiles hold true until a major heating plant conversion occurs.
The Energy Use Intensity (EUI) metric has emerged as a common metric for benchmarking building performance. The basic definition is the annual usage (as kBTU) divided by the building's square footage. However, there are variances on how the usage may be adjusted for climate or occupancy and how the square footage is measured. Therefore EUI's cannot be compared if calculated by different sources.
EFA's EUI has weather-normalized usage and interior, primary-floor SF.
Consumption Modeling – The Base Year
EFA's EUI has weather-normalized usage and interior, primary-floor SF.
The Utility Tracking Center uses an Excel-based reporting tool for “Measurement and Verification” of energy performance under the Facilities Management Program. Guidelines from ASHRAE's GL-14 and DOE's GL-4 are considered where applicable.
A mathematical model is created that calculated the building energy usage based on six period variables (PV) shown here. The model calculates usage that closely matches the actual month-by-month billing trend and must match exactly for annual totals.
The values for period variables based on climate will differ from year to year. The heating and cooling weather data is maintained by various agencies for declared weather agencies. Online weather tools provide search and download services for gathering historical data. EFA uses the Newark Airport Station records and this Weather-Tool.
Energy Price History | Energy Budgets
In November, to assist with school budgeting tasks, the Utility Tracking Center provides an estimate of future energy prices and a method to calculate an estimated energy budget. Pricing estimates are based on future outlook reports provided by the US Energy Information Administration and local/current events concerning tariffs, third party contracts, and sustainable and source energy.